Mapping Portfolio
Web Cartography
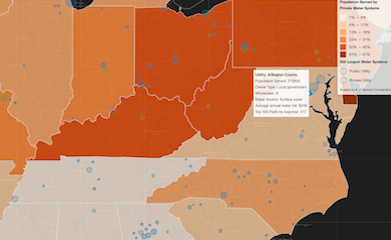
Water
This map shows information about water utility ownership (public vs private) in the United States. The circles represent the 500 largest water utlities in the US and are scaled proportionally based on the population served. The state layer provides
a summary of all water systems and is shaded based on the percentage of systems that are privately owned.
The map was generated using custom Javascript, including the Mapbox, Leaflet, and jQuery libraries. Data from the US EPA's Safe Drinking Water Information System and annual bill survey information from Food and Water Watch was joined in QGIS and geocoded
using the Google geocode API.
Fire
This map shows the percentage of US counties that were burned by wildfires in 2013. Upon zooming, the names and causes of individual fires are available. The time series widget allows users to isolate the data by a data or range of dates.
The map was created in CartoDB.
Power
This thematic map shows the location and capacity of solar, electric, and hydro power plants in the United States.
This map was generated using GeoJSON-encoded data within Leaflet to draw data layers. Custom Javascript was also used.
Home
This choropleth map displays median rental prices by county in the United States. The data comes from the U.S. Census Bureau, 2015 American Community Survey. Data was not available for all counties.
The map was generated using custom Javascript, including the Leaflet and jQuery libraries. External data files were loaded using using AJAX.
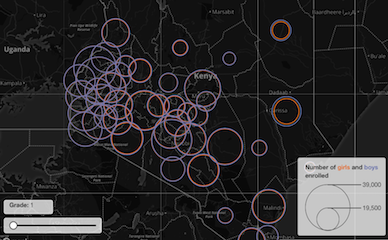
Learn
This map shows the primary school (1st to 8th grade) enrollment of boys and girls in Kenyan counties. The info windows include persistence trends for each county.
The map was generated using custom Javascript, including the Leaflet, Mapbox, Omnivore, jQuery, and jQuery sparkline libraries. Assembly CSS was used.
Brews
This thematic map shows the density of breweries in North America in a hexagonal grid (hexbins). The hexabins are shaded in proportion to the measurement of the statistical variable, in this case, breweries. Hexabin maps differ from choropleth maps
in that equal-sized spaces, rather than political boundaries, are used.
The map was generated in QGIS using SQL and geometry tools.